Live Online • Hands-on Projects • Job Ready
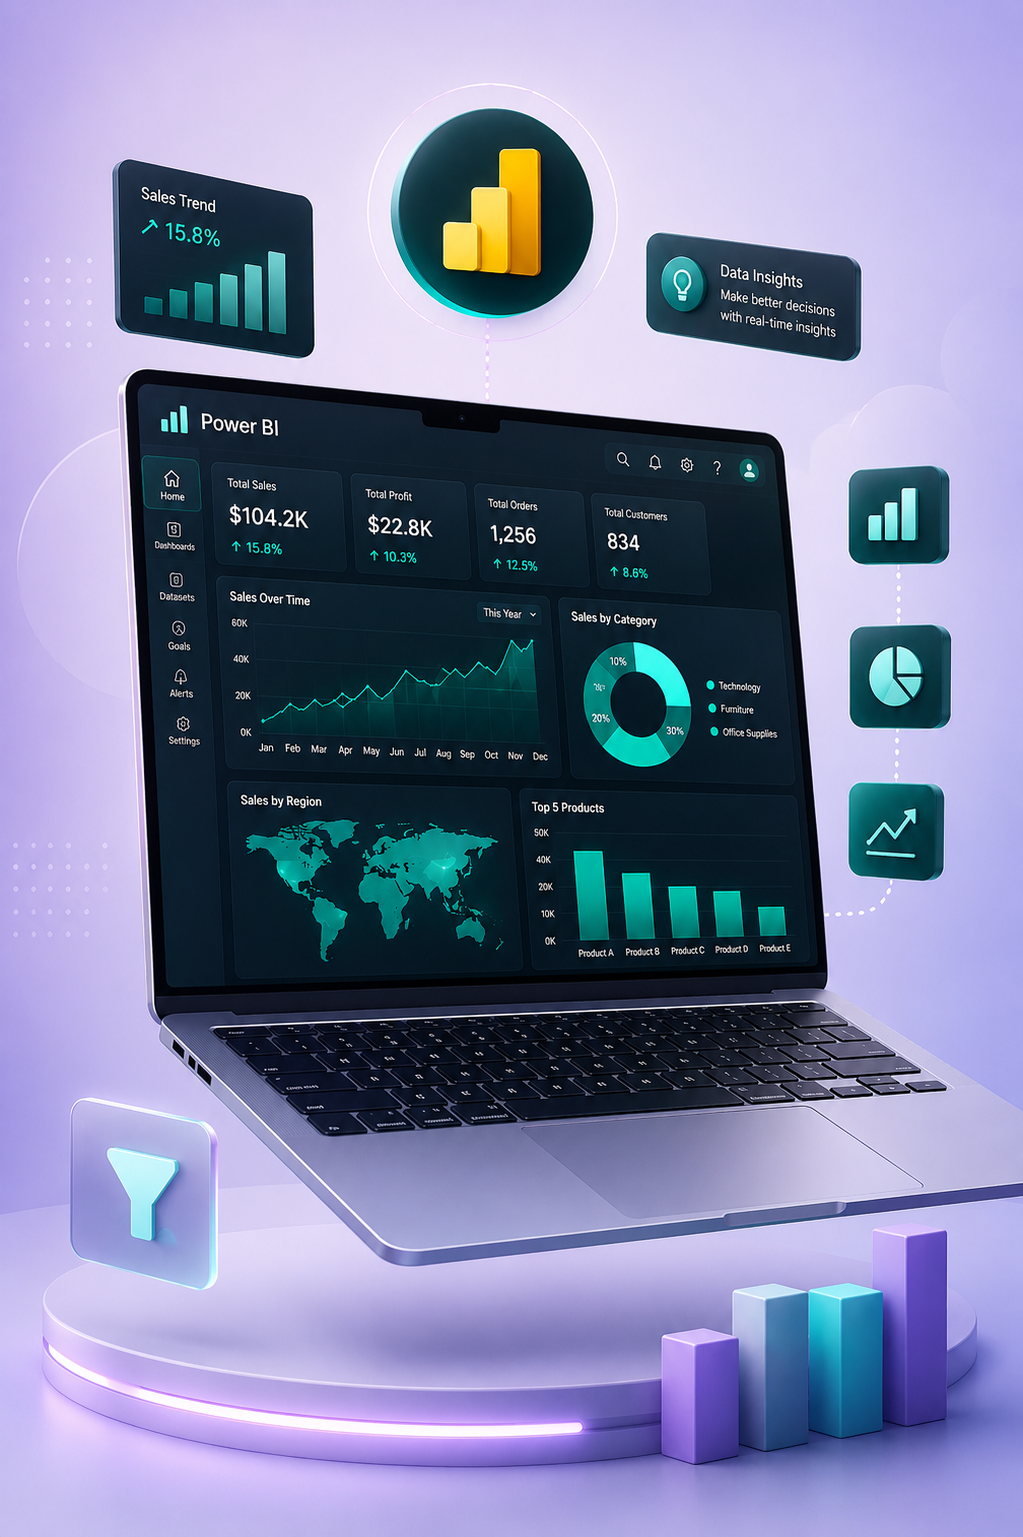
Master Power BI c
Build Dashboards That Drive Decisions
Get instant access to one complete Power BI master course with pre-recorded videos, hands-on assignments, downloadable resources, and doubt-solving support—built to make you job-ready in analytics.


One Power BI Course That Gets You Job‑Ready
Why Choose Us Gets You Job‑Ready

Industry-Led Traininga
Learn from BI practitioners with real dashboard and reporting experience.

Real Business Datasets
Work on sales, finance, HR, and operations datasets—not toy examples.

Career Ready Portfolio
Build dashboards you can showcase in interviews and on LinkedIn.

Pre-Recorded + Practical
Short videos + assignments with the same files used in the lessons.
What You’ll Learn in This Power BI Course
Key Features Power BI Course

Power Query (ETL)
Clean, transform, and automate data prep with M and best practices.

Data Modeling
Build star schemas, relationships, and optimize model performance.

DAX Measures
Master CALCULATE, filter context, time intelligence, and KPI design.

Dashboard Design
Create interactive reports with drill-through, bookmarks, and storytelling.

Sharing & Governance
Workspaces, RLS, apps, publishing, and collaboration best practices.

Interview Case Studies
Practice BI scenarios and build confidence for analytics interviews.

8+
Years in BI Training
Learn modern BI skills with structured lessons and hands-on labs


About the Program
From Data to Decision with Power BI
We focus on practical BI skills: connect data, transform it, model it correctly, write DAX measures, and deliver dashboards stakeholders actually use.

Our Goal
Help you become a confident Power BI analyst with portfolio-ready projects.

Our Approach
Learn-by-doing: weekly assignments, mentor feedback, and real datasets.
Designed for beginners to working professionals—move from Excel reporting to modern BI with Power BI.


Trusted by 15,000+ learners building careers in analytics
9.8/10
Course Satisfaction
Clear explanations, practical labs, and fast support.
13k
Projects Delivered
Assignments + capstone dashboard you can showcase.

“This Power BI course finally made DAX click for me.”
A focused track built for real BI work: data prep, modeling, DAX, dashboard UX, performance, and sharing—plus practice files, templates, and support.
- Hands-On Labs with Real Data
- DAX Patterns & Time Intelligence
- Performance Optimization
- Capstone Dashboard Project
- Doubt Support + Resources Pack
Why This Power BI Course? 

Flexible Schedule
Pre-recorded lessons so you can learn anytime and repeat topics.

Progress Tracking
Track modules, assignments, and your capstone progress.

Expert Trainers
Get doubt-solving support for DAX, modeling, and visuals.

Interactive Learning
Practice with real datasets, files, and dashboard templates.


Testimonials
I moved from Excel reports to Power BI dashboards in weeks. The DAX explanations and assignments made everything click.
The step-by-step Power Query lessons saved me hours at work. I now automate data cleaning and refreshes confidently.

The modeling + performance tips were gold. My dashboards load faster and stakeholders finally trust the numbers.
The capstone project is the best part. I shipped a portfolio dashboard that I used in interviews—and got hired.

Time intelligence used to confuse me. Now I can build YoY, YTD, and rolling measures without guessing.

Clear, practical, and directly useful at work. I rebuilt our sales dashboard with bookmarks, drillthrough, and RLS.

The course structure is perfect: learn → practice → build. My portfolio now has two dashboards and a DAX cheat sheet.
The mentor feedback helped me fix modeling mistakes and design a cleaner report UX. Huge improvement in my work dashboards.
The assignments mirror real stakeholder requests. I finally understand filter context and measure branching.

Best structured Power BI course I have taken. Templates and datasets alone are worth it for client projects.


Acheive you Goals with Logo
96% of eLearning for Business customers see improved results within six months.
253,085
Students Enrolled all over World
1,205
Total Courses on our Platform
56
Countries of Students
968
Expert Tutors From Various Fields

Articles


Publishing to Power BI Service: Workspaces, Sharing, and RLS Basics
Power BI Service hosts datasets, reports, and apps. Use workspaces for collaboration and apps for broad distribution. Row-level security (RLS) restricts rows per user—define roles in Desktop and vali…

Designing Executive Dashboards That Stakeholders Actually Use
Great dashboards answer a decision in seconds: clear KPIs, consistent color semantics, and drill paths for exceptions. Use bookmarks for guided storytelling and keep dense grids off the first page.Al…
Time Intelligence in DAX: YTD, MTD, and Prior Year
Time intelligence requires a Date table marked as a date table in the model. Functions like TOTALYTD, SAMEPERIODLASTYEAR, and DATESYTD depend on continuous date coverage.Validate fiscal vs calendar r…
DAX Measures Every Beginner Should Master First
Start with explicit measures instead of implicit column aggregations. Master SUM, CALCULATE to modify filters, and DIVIDE for safe ratios. Understand row context vs filter context before time intelli…
Data Modeling in Power BI: Star Schema in Plain English
A star schema centers a fact table (transactions, events) surrounded by dimension tables (customers, products, dates). Clear relationships reduce ambiguity in filter context and make DAX measures pre…